Galleon 2026Download our mobile shopping application for faster and easy transaction.
Product ID:
622923
Identifier:
1589485572
Brand:
Esri Press
Model:
Shipping Weight:
2.54 lbs
Manufacturer:
Esri Press
Shipping Dimension:
10 x 10 x 1.14 inches
₱7,258
₱3,536
+ ₱ 1,512
Shipping Cost from USA to Philippines inclusive of custom fees.
Cost too high? Check weight and dimension on product details and click "I think this is wrong?" link.
Get it between 2026-04-21 to 2026-04-28.
Additional 3 business days for provincial shipping.
- Price and Stocks may change without prior notice
- Packaging of actual item may differ from photo shown
Cash upon Pick-up - orders grand total must not exceed ₱5,000.00. Order will be pickup at Galleon's Office.
Cash on Delivery - orders grand total must not exceed of ₱10,000.00 and must not exceed ₱5,000.00 for provincial areas. See all payment methods
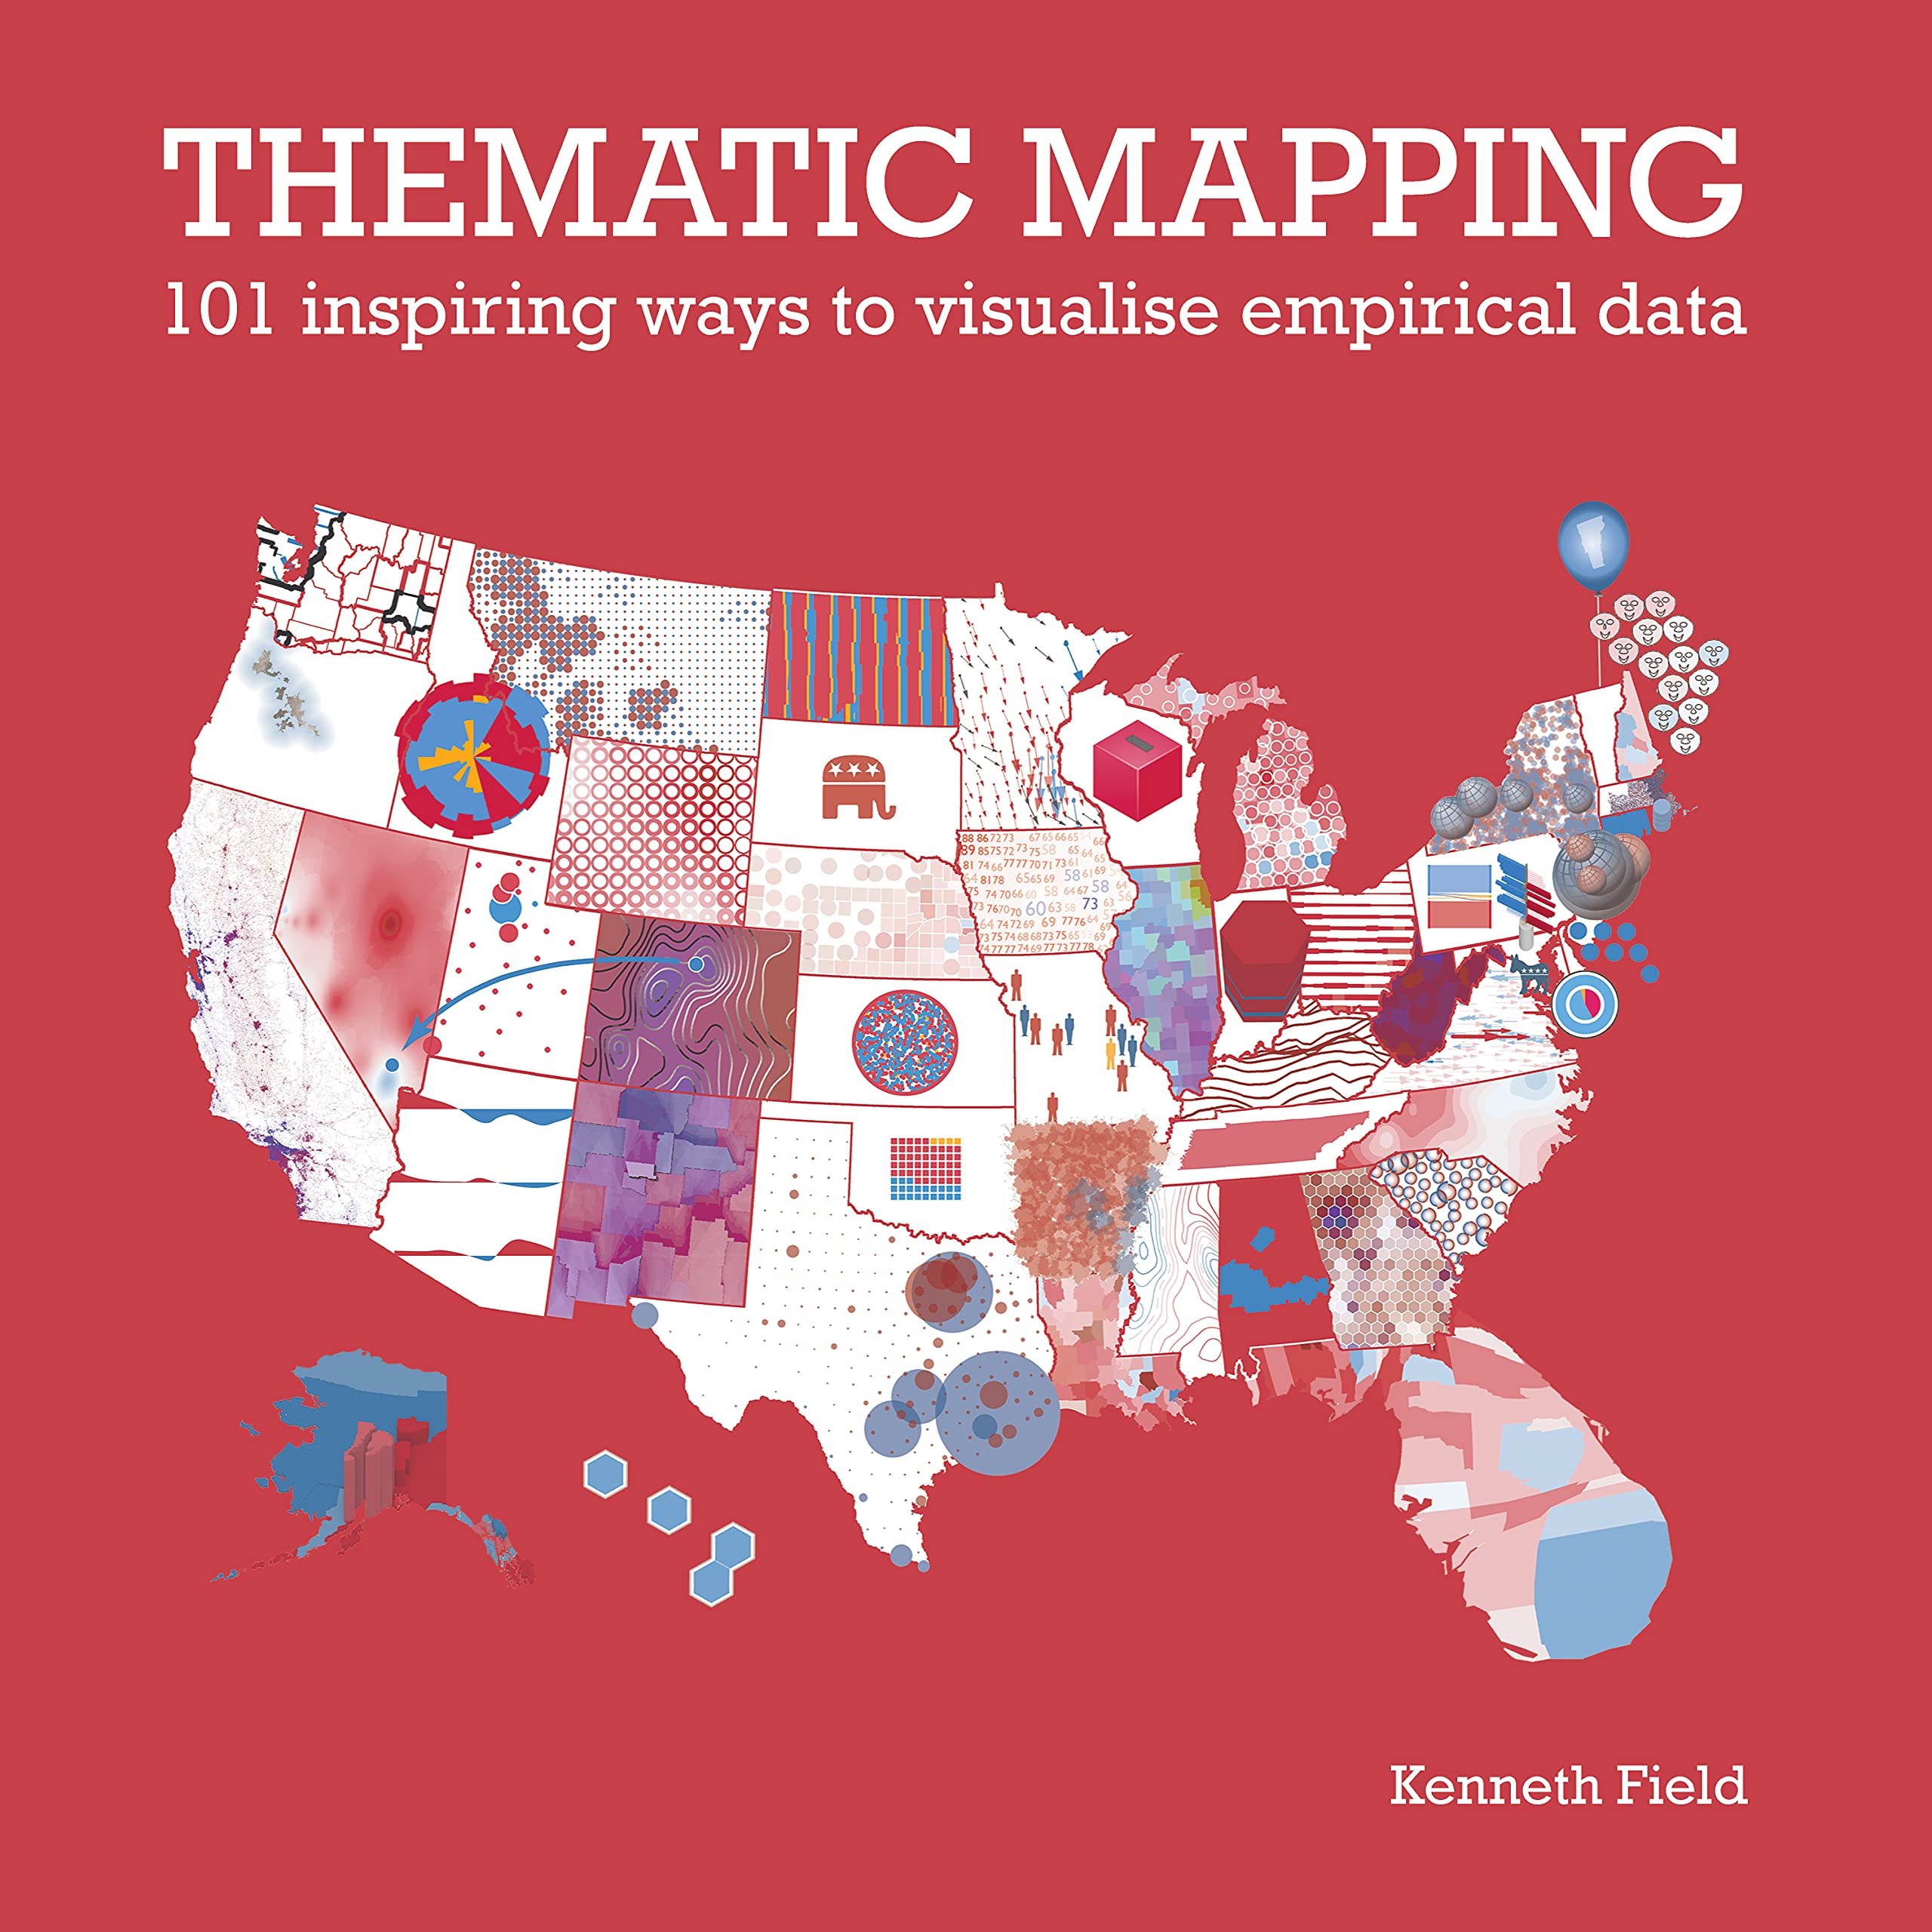
First place winner in Educational Products at the 2021 International Cartographic Conference Maps are ubiquitous, yet maps are not made equally, nor are they read equally. Every map is a product of its maker and its reader, and maps are rarely right or wrong but simply different versions of the truth. The meaning you see in a map can reinforce or challenge your understanding of the theme it represents, and you are much more likely to believe a map if it presents a version of the truth that you believe in already. But how do you decide what map you want to make? How do you understand the way in which different maps can be used in different ways to tell a story? How do you design a map to be read in a particular way? Thematic Mapping: 101 Inspiring Ways to Visualise Empirical Data answers these questions, and more. Using 101 maps, graphs, charts, and plots of the 2016 United States presidential election data, Thematic Mapping explores the rich diversity of thematic mapping and the visual representation of data. It details well-known techniques and demonstrates how to design effective maps and graphics. Each map illustrates a different approach to the same data, and all lead to different maps and different ways of seeing different shades of truth. Thematic Mapping examines the innovative and fascinating alternative ways of making maps of data which you can use in your own work. Which will speak to your truth? -- Ken Field
Buy products not available in the Philippines.